Tables and Output Pins
Refer to your controller documentation for each output pin's exact specifications.
Not all outputs are at the same accuracy (WBlin is 12 bits on professional models,
but only 9.5 bits on economy models), and not all outputs are available on all controllers.
However, all outputs can be reprogrammed using WButil, and the output curve can be manually
checked if you have a voltmeter (or use the target device connected to the voltage output).
Basics : To re-program an output, first make sure the correct controller and sensor type is selected
on the Controller Tab of the General page
as this will change the selections available on the page shown at left as well as some of the raw
programming parameters used.

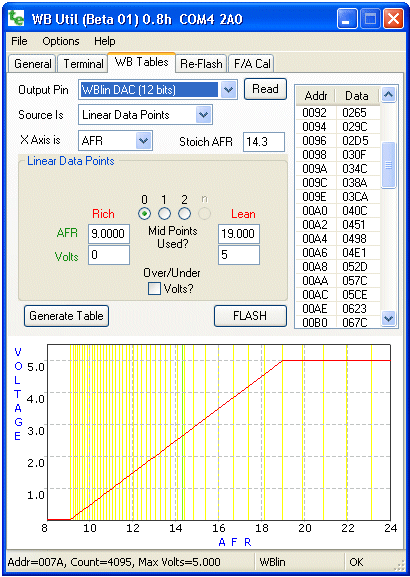
Now select the Output Pin to re-program - the example shows the WBlin output has been selected,
and that WBlin uses a 12 bit (4095 individual steps over the voltage range) hardware DAC
(Digital to Analogue Converter) - other outputs may use a lower quality
PWM (Pulse Width Modulator) converter.
The graph scale's Y axis (VOLTAGE) also changes with the maximum voltage available on the output pin.
 Note that the status bar (at the bottom of the application as shown in the image)
shows technical information about the selected pin.
In this case, maximum voltage for the pin (based on the unit type being corrected selected)
is 8.191 Volts (at a DAC count of 4095) and the output type is a 12 bit DAC (D12).

Source and Axis Selection
The Source Is selection determines the source of data to re-program the table.
The example shows Linear Data Points have been selected - this allows simple straight line
graphs to be easily created.
Other options are Data From File and Predefined Table.
These and more fully described below.
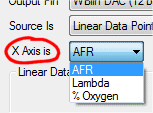
The wideband controller is really a Lambda controller.
Lambda can be directly converted to either AFR (Air-Fuel-Ratio), or % Oxygen (percent O2).
The X Axis is menu selects this value to use, and attempts to convert the displayed data points
from the currently selected value to the new value.
This sometimes means a 1.0 will be converted to 0.9999 if repeated conversions are made.
Also, a rich λ/AFR will be converted to a negative oxygen percentage
and this will sometimes result in strange looking curves - we didn't try and fix these
strange displays because it alerts you to the possibly "strange" data points present.

The Stoich AFR value can only be set if AFR has been selected for the X-Axis.
The relationship between Lambda and AFR depends on the Stoich AFR as shown in the box at left
The correct Stoich AFR should be selected for your fuel if you want to re-program
the outputs in native AFR units for your fuel.
Source is : Linear Data Points

The image at right is for the Source Is Linear Data Points selection
(and with X Axis AFR selected).
It has four text boxes near the centre -
they are organised vertically as (value, voltage) pairs.
In this example value is AFR because the X-Axis has been selected as AFR.
The lower text boxes are for entering the voltage on the output pin at each AFR point.
The second data point graph (above, main image) shows how VOLTAGE (Y-axis) and AFR
(X-axis) are related by setting just those two pair of data points.
Specifically, the two data points are 1: (AFR=9.00, Voltage=0.0) and 2: (19.00, 5.0).
Note that on the graph the green vertical stoich line (at AFR=14.3 in this example),
and the vertical yellow lines that represent actual table entries.
More info on using the graph is presented below.

Mid Points Used? :
Apart from the two end points, one or two mid-points may be added to the graph using the Linear Data Points
interface (there may be an n-point option in the future).
The graph at left shows the 4 point option.
The red line annotation matches the second data pair of data points (AFR=13.0 at V=1.8V)
with the matching point on the graph.
Over/Under Volts? :
 This option produces a fixed output voltage below the richest (ie. lowest) λ/AFR) and above the leanest λ/AFR.
The effect this has on the output can best be demonstrated by actually selecting the option and viewing the results.
The option is often used to prevent the output falling below a minimum value (say 0.1 Volt), allowing some measure
of fault detection in attached equipment should the output voltage be disconnected.
Graph Options
The graph can be resized by grabbing the lower right corner of the application, and dragging.
The graph shows the most commonly re-programmed area of the controllers output -
it does NOT show the range all the way to free-air on the λ & AFR selection, but does when Percent oxygen is selected.
A Left mouse click on the graph will select the closest (nearest Ipx value) table cell,
will highlight that Ipx value,
and leave an indication of the point on the graph.
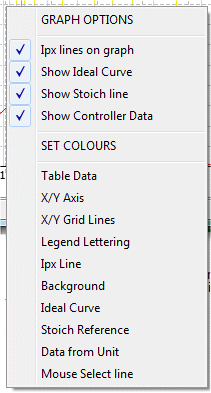
A Right mouse click on the graph brings up the menu shown at right.
The format and colour of many of the graph's elements can be customised as follows:
Ipx Lines : are the vertical yellow bars on the graph.
Each line represents a single table cell, with the value of the cell setting the output voltage point on each Ipx line.
The curve's colour is set by the Ipx Line selection in the SET COLOURS section of the graph options.
Ideal Curve : is the graph line that fits the requested data points exactly and is the dark blue line seen on some graphs.
Because the data points are constrained to be on Ipx lines, the actual output voltage sometimes is not precisely what is desired.
The line's colour is set by the Ideal Curve selection.
Stoich Line : is the green line representing λ = 1.0 exactly.
Note that it is between two Ipx lines and, for X Axis is AFR graphs,
is at the point set in the Stoich AFR
text box to the right of the X Axis is menu.
The colour is set by the Stoich Reference selection.
Show Controller Data : is displayed by the orange graph line when the table data from the controller
has been read back using the [Read] button.
The curve's colour is set by the Data from Unit selection.
Source is : Data From File
A special file (.ipx format) may be used to re-program any of the outputs.
We have not publicly document the format of this file yet.
Source is : Predefined Tables
Several predefined tables, set up in the .ini files supplied with WButil, can be selected
and programmed into the controller.
|  Output Programming : Tables used to program the controller's outputs are set up here.
Voltages generated by output pins can also now be tested independently of external sensors.


 Note that the status bar (at the bottom of the application as shown in the image)
shows technical information about the selected pin.
In this case, maximum voltage for the pin (based on the unit type being corrected selected)
is 8.191 Volts (at a DAC count of 4095) and the output type is a 12 bit DAC (D12).


 This option produces a fixed output voltage below the richest (ie. lowest) λ/AFR) and above the leanest λ/AFR.
The effect this has on the output can best be demonstrated by actually selecting the option and viewing the results.
The option is often used to prevent the output falling below a minimum value (say 0.1 Volt), allowing some measure
of fault detection in attached equipment should the output voltage be disconnected.

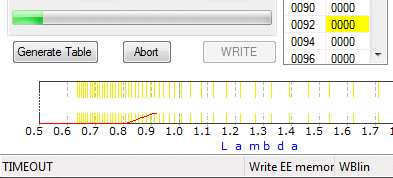 The [WRITE] button is used to send data from the 65 point table that has previously been populated
with data (from one of the possible data sources, or from the controller itself), to the controller.
The table is the one selected by the Output Pin drop-down menu.
The image shows that, on pressing the [WRITE] button, a status/progress bar appears and
the table entry currently being written is highlighted.



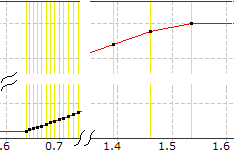 Tables are made up of 65 data points, each of 16-bits.
This lets us represent 64 data intervals between the lambda sensor's
measurement extremes (ie. maximum rich ≅ 0.6 λ all the way to free-air).
Each data point has a fixed λ value and a configurable voltage associated with it.
Note how the vertical graph lines are compressed to the left, but expand out to the right.
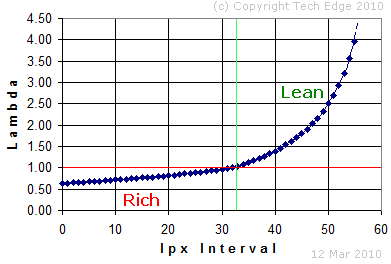
The λ intervals are not equally spaced because the underlying values they represent
do not have a linear relation ship with λ.
The underlying native value used inside the controller, that comes almost directly from the sensor,
is called the normalised pump-current, or Ipx).
Because of the non-linear relationship between λ and Ipx, the λ differences between
the table's adjacent voltage entries varies across the table.
On the other hand, there is a direct relationship between the table entry and the voltage produced.
 The status bar also tells us that the Max Volts=5.000 so we can assume
the 613 value represents 613*5/4095 = 0.748 Volts.